
Start with one slow page
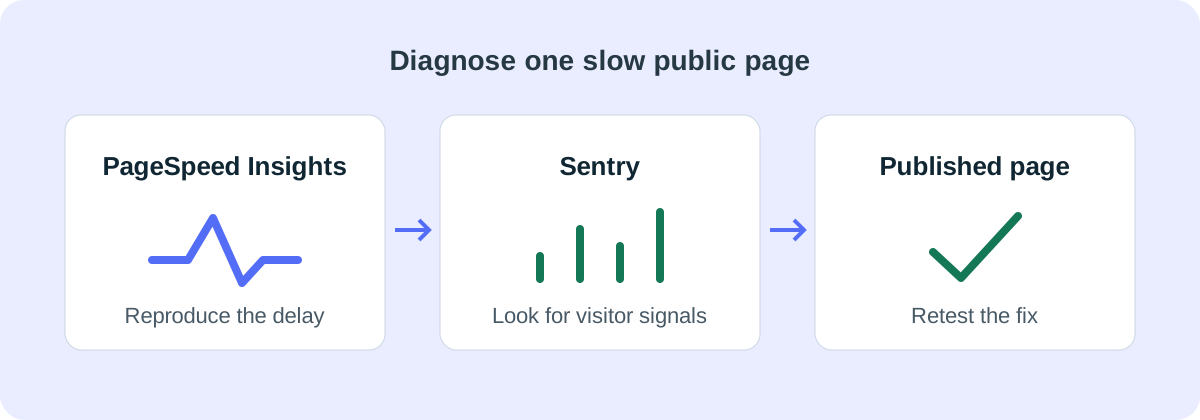
Open the public URL that feels slow in PageSpeed Insights and look at the mobile report first. Pick the page people actually land on, whether that is your homepage, a service page or a product page. Testing a preview or an account dashboard answers a different question.
Write down what you notice on a phone. Does the main heading appear quickly while the big image takes seconds to arrive? Does the page jump as it loads? Does it look ready but hesitate when you tap? That symptom tells you where to look in the report.
On 9 November 2026, Lovable announced that its Sentry connector can send errors and performance data from the app to a Sentry project. Once set up, it gives you somewhere to look when visitors report a problem you can’t reproduce. You can start with PageSpeed Insights before connecting Sentry.
Read the PageSpeed report
PageSpeed Insights shows two kinds of evidence. Field data comes from eligible Chrome visits over the previous 28 days. Check whether the report is for your exact URL or the origin, meaning the same scheme, hostname and port. Origin data combines eligible visits across URLs and won’t tell you which page caused a slow result.
The lab report uses Lighthouse to simulate a single page load under controlled conditions. Use it to reproduce and investigate a delay, especially when your URL has too few visits for field data. Google explains how PageSpeed Insights collects both kinds of data.
- The main content appears late. Look at Largest Contentful Paint (LCP) and identify the element in the lab report. If it is the hero image, compare resource load delay, the wait between the first byte of the page response and the image request starting, with resource load duration, the time spent loading the image. A smaller file can help when the download is the bottleneck.
- The layout moves as you read. Look at Cumulative Layout Shift (CLS). Check whether images, embeds or late banners push content down because they had no space reserved.
- Taps feel sluggish. Interaction to Next Paint (INP) measures how quickly the page updates after interactions such as taps and clicks. Look for it in the field data. The Lighthouse page-load test has no interactions to measure, so use Total Blocking Time as a rough clue to heavy JavaScript. Repeat the slow interaction on a phone or record it in browser developer tools.
Save the URL, test date and the finding you’ll compare later, such as the LCP element and how long it took to appear. Google’s Core Web Vitals guidance sets good thresholds at 2.5 seconds or less for LCP, 200 milliseconds or less for INP, and 0.1 or less for CLS, measured at the 75th percentile of visits.
Use Sentry when the problem comes and goes
In Lovable’s Connectors, add the client key (DSN) for your Sentry cloud project. You need permission to create the connection. Then ask Lovable in the project chat to link the app to Sentry. A correctly formatted key can save even if it points to the wrong project, so check that a controlled test event from the running app arrives in the intended Sentry project. The app connector sends data. The separate chat connector lets Lovable read your Sentry data. Lovable’s Sentry setup guide has the full steps.
Look for events from the public URL you tested. Check any details that are available, such as the URL and browser, and try to reproduce the problem under similar conditions.
Check what your setup actually collects. Lovable documents error and performance reporting, with the available measurements and volume depending on your setup and traffic. If you have little data, keep working from a repeatable browser test. If the main content never appears, follow the Lovable empty-page guide.
Worked example: a heavy hero image
Illustrative example. A cleaning company’s Lovable service page shows its headline quickly, then leaves a blank space where the hero photo should be. PageSpeed Insights has no real visitor data for that URL. The mobile lab report identifies the photo as the LCP element. They set Chrome’s device toolbar to a phone, open the Network panel and reload. The photo request starts early, but the browser downloads an image far wider than the space it fills and spends most of the delay loading it.
Ask Lovable for a focused change: “On this service page, serve a smaller responsive image on mobile, preserve its aspect ratio and avoid lazy-loading the hero image. Show me which file and component you changed.” The long download is the first thing to fix in this example. If the request had started late, you would instead check whether lazy loading or JavaScript was delaying discovery. See Google’s LCP guide for both cases.
Check the same public URL after publishing
- Repeat the mobile lab test a few times. Compare the measurement you set out to improve. In the photo example, check that download time falls and see whether the photo still determines LCP. Allow for normal variation between runs.
- Check on a real phone. Make sure the photo still looks right, the layout holds and the page’s main links and forms work.
- Where you have enough real visitor data, compare similar devices and time periods. PageSpeed’s rolling 28-day field data will still include visits from before the fix.
Speed measurements describe page experience. If a page is missing from Google, use crawl and indexing evidence to diagnose it with the indexing guide.